

London Property Investment
Global capital. Global demand. Long-term capital.
London remains the world's most liquid property market and the single-largest destination for international investment capital. Outer-London boroughs, Crossrail-connected zones and PRS-designated sites offer the best rental-vs-capital balance in the current cycle.
Population forecast
9.6m by 2030
Price growth 5-yr
+13.9% (2024-29)
Rental growth 4-yr
+15.1% (2024-28)
New-home pipeline
37,000 pa (vs 340k need)
Forecasts: house prices (JLL), rents (Savills), population (ONS), new-home pipeline (Red Cardinal analysis of local planning data). Last updated June 2026. Full sources below.
Why London
Five reasons London is on our investment radar
- 01
£4 of every £10 of international property capital into the UK flows to London.
- 02
Crossrail (Elizabeth Line) has structurally reprised 41 outer-zone stations.
- 03
Highest long-term capital growth of any UK city: 6.1% CAGR over 40 years.
- 04
Strict supply: 340,000 annual need vs 37,000 delivered pa.
- 05
Global-first political stability, legal system and currency store-of-value.
Areas we source in
London's target postcodes
Canary Wharf & Docklands
Financial cluster + major new residential supply.
Stratford & Olympic Park
E20 regen masterplan; best value vs Zone 1-2.
Elephant & Castle
£4bn regeneration; strong rental demand.
Woolwich & Abbey Wood
Elizabeth Line uplift still working through.
White City & Old Oak
BBC, Imperial, and HS2/Crossrail 2 interchange.
Connectivity
Transport links
- 6 international airports
- Elizabeth Line, 41 stations, 100m journeys a year
- 12 Underground lines, Overground, DLR, Thameslink
- HS1 international rail (St Pancras)
Typical investment profile
At a glance
- Entry price
- £320k to £1250k
- Gross rental yield
- 3.5% to 5.5%
- Student population
- 420,000+ students
- Universities
- 40+ universities
London is a long-term capital-preservation play. Yields are lower than regional cities, but historical volatility is lower, liquidity is higher, and the international buyer base provides a natural exit.
Tenant profile
Who rents in London
City and Canary Wharf finance and tech professionals, global graduates on 3–5 year stints, international students. East End regeneration zones pick up priced-out millennials and key workers.
Median age
35 years (lowest in England); inner-east boroughs 30–32
Private renters
30% London-wide; 40%+ in Tower Hamlets, Hackney, Newham
Graduate retention
77% (highest in UK, Centre for Cities)
Avg household income
£79,555 GDHI per head Westminster + City (ONS 2023)
Pipeline
London regeneration timeline
Major schemes actively delivering across London. These drive the capital-growth forecast, footfall, and rental demand that underpin every investment we source here.
Old Kent Road Opportunity Area
£10bn+2026–2041Southwark-led corridor anchored by Bakerloo Line Extension, ~20,000 homes, 10,000 jobs
Earls Court
£8bn+ GDVConstruction from late 2026, phased to 204140-acre masterplan by Earls Court Development Company / Delancey / APG, ~4,000 homes
Brent Cross Town
£8bn2024–2031180-acre N London JV, Related Argent + Barnet Council, 6,700 homes + 3m sq ft offices
Silvertown Quays (Royal Docks)
Up to £24bn GDVFirst homes 2025, build to mid-2030sLendlease + Starwood / Crown Estate JV, up to 6,500 homes
Live in London
Currently available

London
Woolwich Quarter
Elizabeth line living by the Thames, eight minutes from Canary Wharf.
- From
- £415,000
- Completion
- Q1 2028
- Area
- Woolwich, SE18, Zone 4

London
Bermondsey Tower
Zone 1 SE1, a 12-minute walk to London Bridge.
- From
- £635,000
- Completion
- Q4 2028
- Area
- Bermondsey, SE1, Zone 1

London
Nine Elms Living
A 36-storey Zone 1 tower, three minutes from the Northern line.
- Completion
- Summer 2030
- Area
- Nine Elms, SW8, Zone 1
London
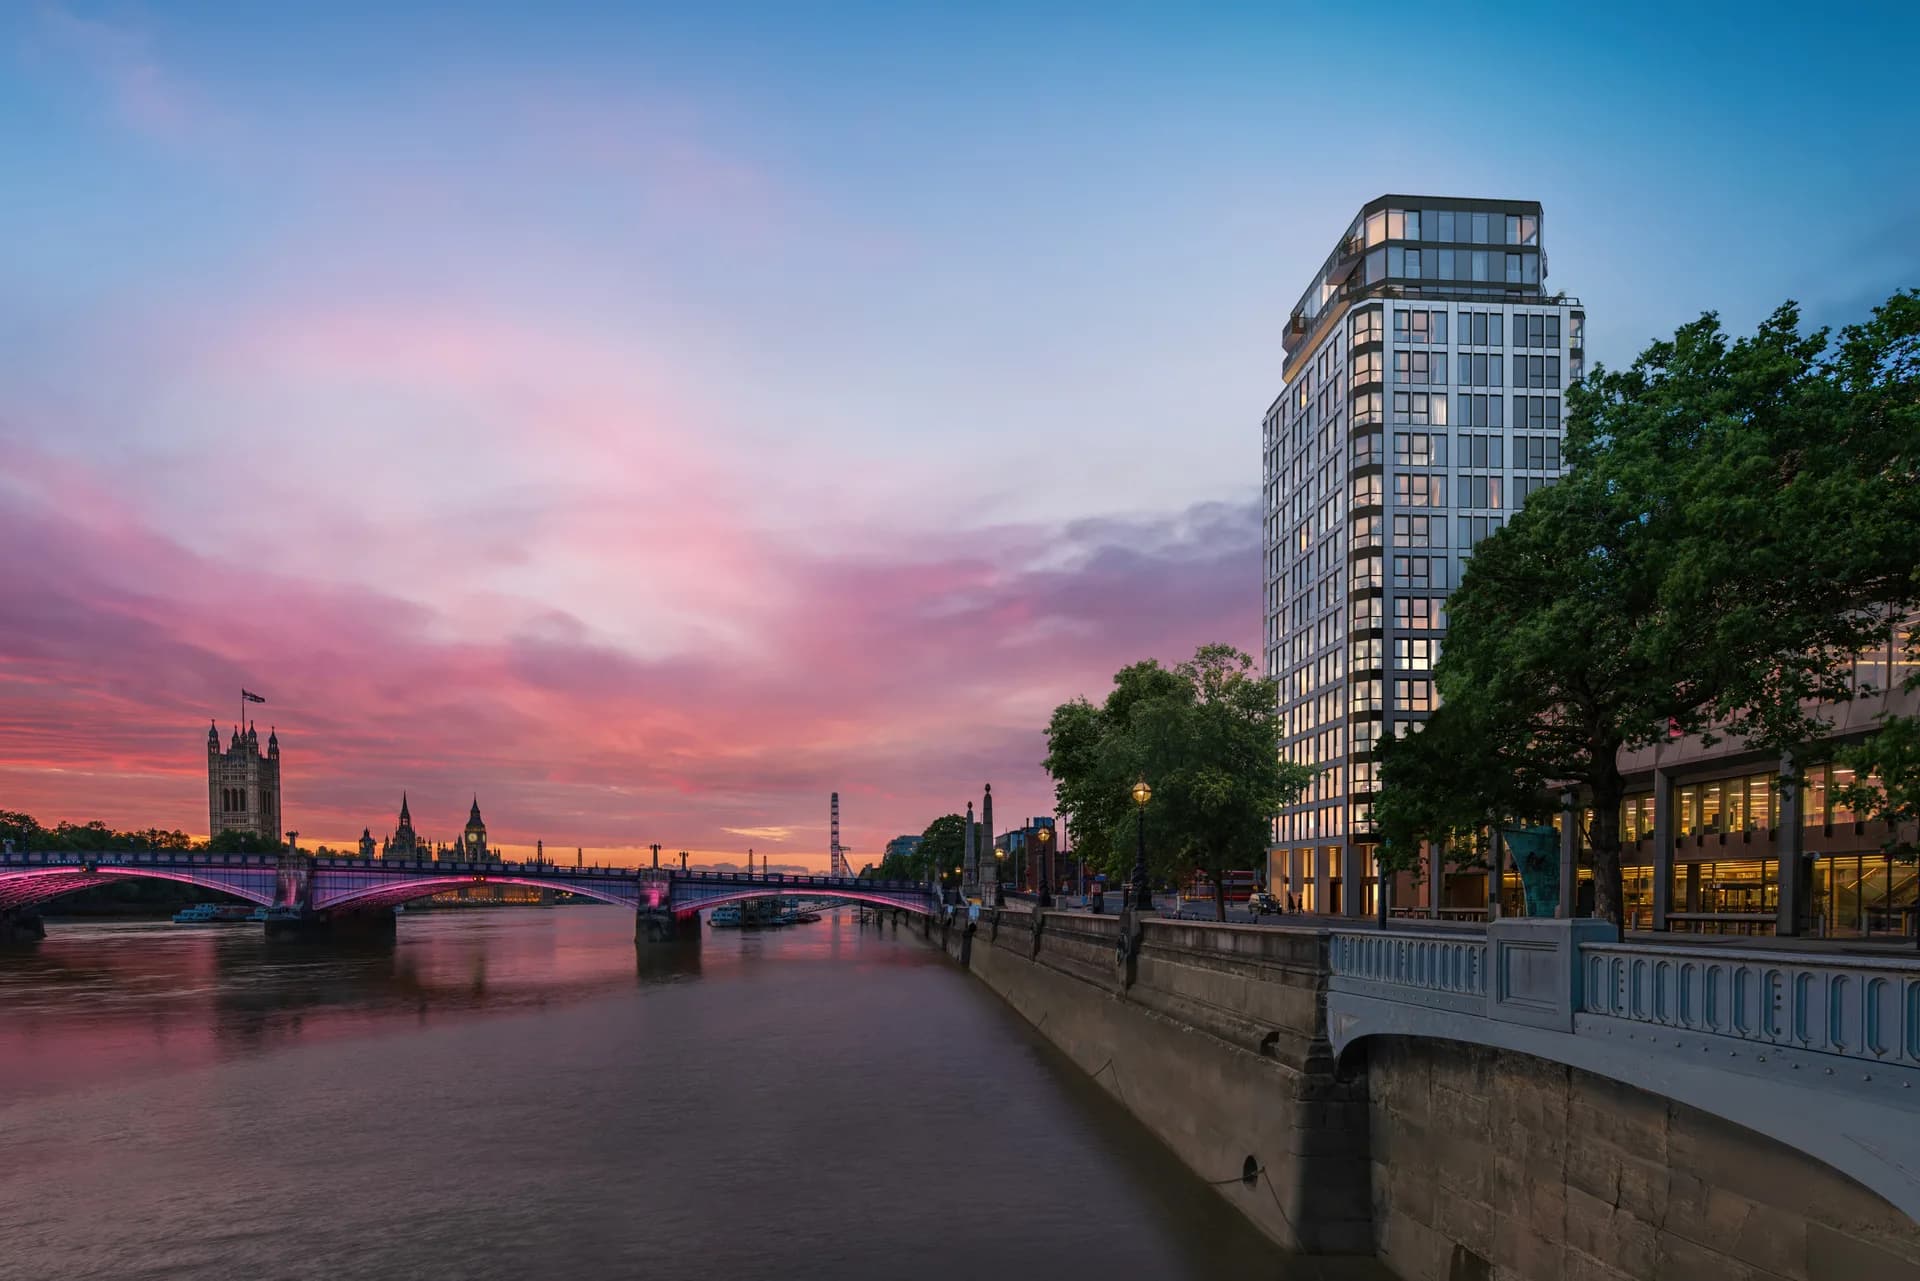
Westminster Haus
Thirty riverside residences facing the Houses of Parliament.
- From
- £2,500,000
- Completion
- Q1 to Q2 2028
- Area
- Albert Embankment, SE1, Zone 1
London
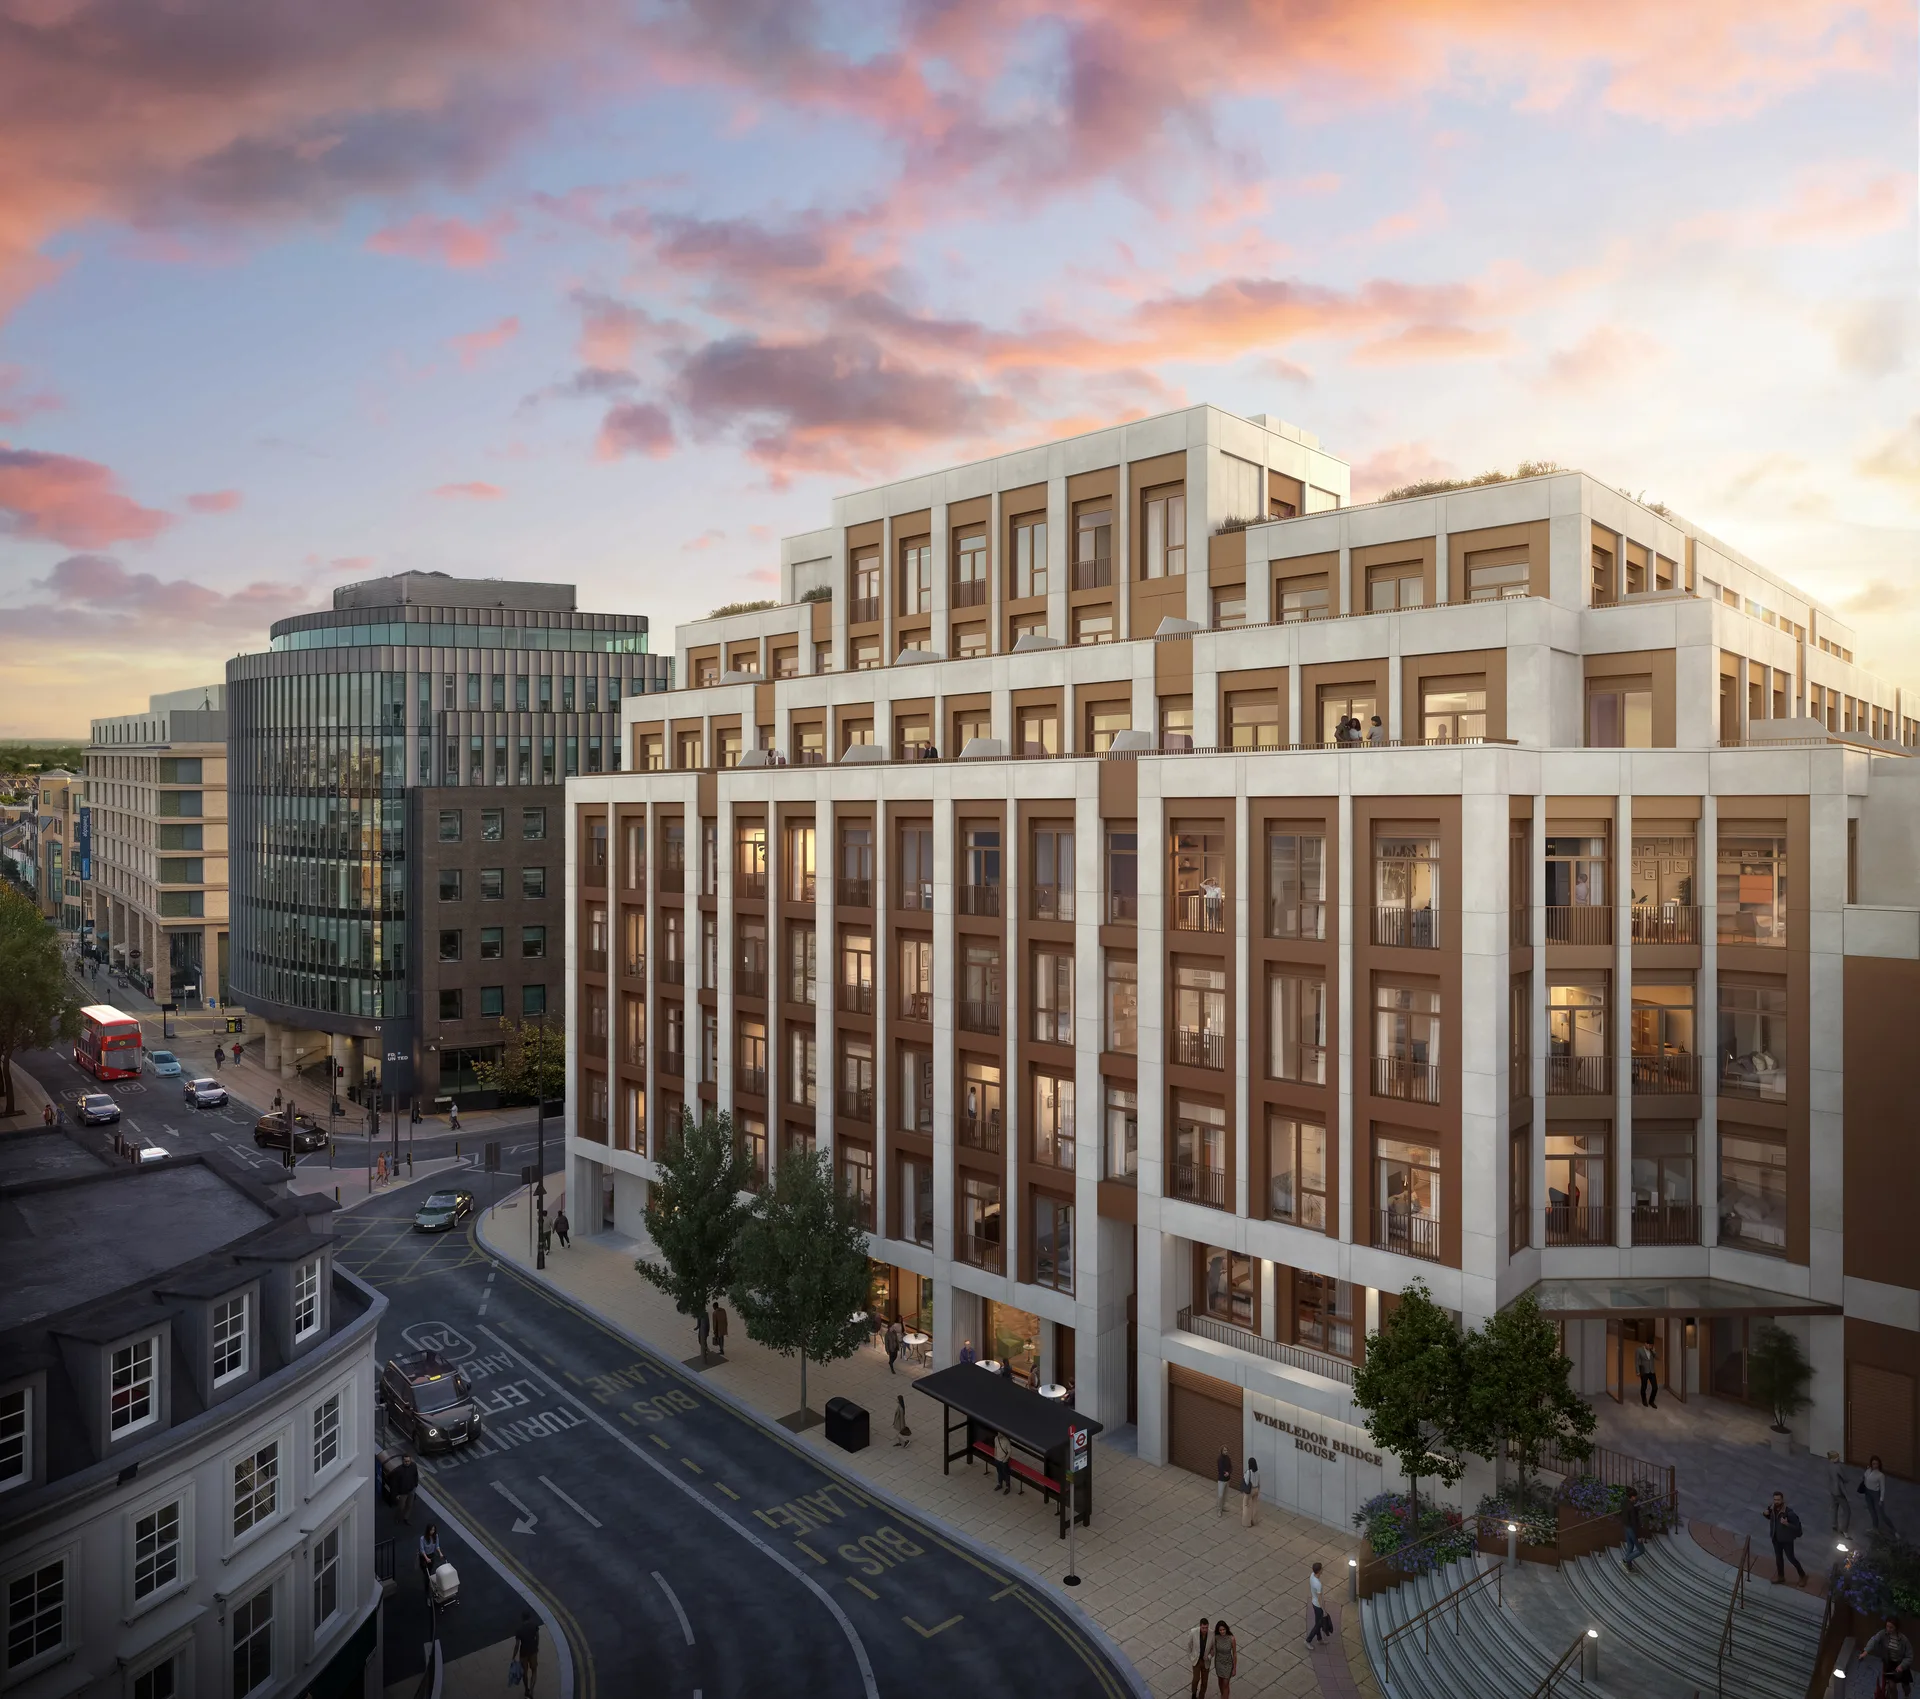
Wimbledon Residence
Beside Wimbledon station, 17 minutes from Waterloo.
- From
- £487,500
- Completion
- Q3 2028
- Area
- Wimbledon, SW19, Zone 3

London
The BeCa
Zone 2 London, £10bn regen corridor.
- From
- £440,000
- Completion
- Q1 2027
- Area
- Old Kent Road, SE15, Zone 2

London
Old York Mews
A peaceful sanctuary within Wandsworth Town, SW London.
- From
- £647,000
- Completion
- Q2 2026
- Area
- Wandsworth Town

London
The Moxon
Quiet luxury in North London's most desirable village setting.
- From
- £374,000
- Completion
- Q2 2028
- Area
- High Barnet, North London

London
Claremont Quarter
Contemporary urban living in a major London regeneration zone.
- From
- £439,995
- Completion
- Q4 2026
- Area
- Cricklewood, North London

London
Heathside
Premium apartments in connected Zone 2 Greenwich.
- From
- £430,000
- Completion
- Completed
- Area
- SE10 Greenwich, Lewisham/Deptford border

London
Keepers Yard
Stylish modern living with premium amenities in vibrant Tottenham.
- From
- £427,500
- Completion
- Q4 2025
- Area
- N17 Tottenham

London
Battersea Park Residences
Prime SW11 riverside, beside Battersea Park.
- From
- £720,000
- Completion
- Built, move-in ready
- Area
- Chelsea Bridge, Battersea, SW11

London
Fulham Park Residences
Prime SW6, six acres of gardens off the King's Road.
- From
- £725,000
- Completion
- Phased delivery, enquire for latest release
- Area
- Fulham, SW6

London
Bow Park Residences
East London's Golden Triangle, a new five-acre park.
- From
- £400,000
- Completion
- Built, move-in ready
- Area
- Bow, E3

London
Wood Lane Residences
Zone 2 White City, eight acres of gardens by Westfield.
- From
- £745,000
- Completion
- Phased delivery, enquire for latest release
- Area
- White City, W12
Browse London by strategy
Investing in London
Guides by investor type
London Market Report
The London Property Investment Report 2026
- Full 5-year forecast for London house prices and rents
- Postcode-level yield hotspots with comparable rents
- Developer and scheme-level shortlist for the next 12 months
- Financing, tax and structure guidance for London investors
London FAQ
London property investment: your questions
Sources & methodology
Last updated: June 2026
Forecasts and market figures for London are drawn from published third-party research and primary government datasets, combined with Red Cardinal's own sourcing and transaction data. Forecasts are estimates, not guarantees, and are reviewed quarterly.
- JLL Residential Forecast
- 5-year house price growth
- Savills Residential Research
- 4-year rental growth
- ONS population projections & Mid-Year Estimates
- Population forecast and demographics
- HM Land Registry House Price Index
- Historic prices and value baselines
- RICS UK Residential Market Survey
- Demand, supply and sentiment context
- Local Plan & planning portal data
- Regeneration pipeline and new-home supply
Next Step
Invest in London with Red Cardinal
Book a 20-minute call and we'll share three live opportunities, off-plan and completed, matched to your budget and yield target.
Book a Free Consultation