London Property Prices: New Data Highlights 30 Declining Areas
While UK property values have risen overall, London property prices reveal notable declines across several high-profile boroughs. For prospective buyers and homeowners alike, these developments may therefore offer opportunities or, conversely, raise concerns, depending on where they live.
A Mixed Picture for UK Property Prices
According to the latest Land Registry data covering the 12 months to March 2025, the average UK home now costs £271,415. That’s an annual increase of 6.4%, equivalent to an extra £16,333. Despite this national upswing, the growth isn’t universal – 30 council areas have actually witnessed a drop in average property values.
Interestingly, the sharpest declines have occurred in some of the most expensive parts of the country, with London boroughs in particular dominating the list.
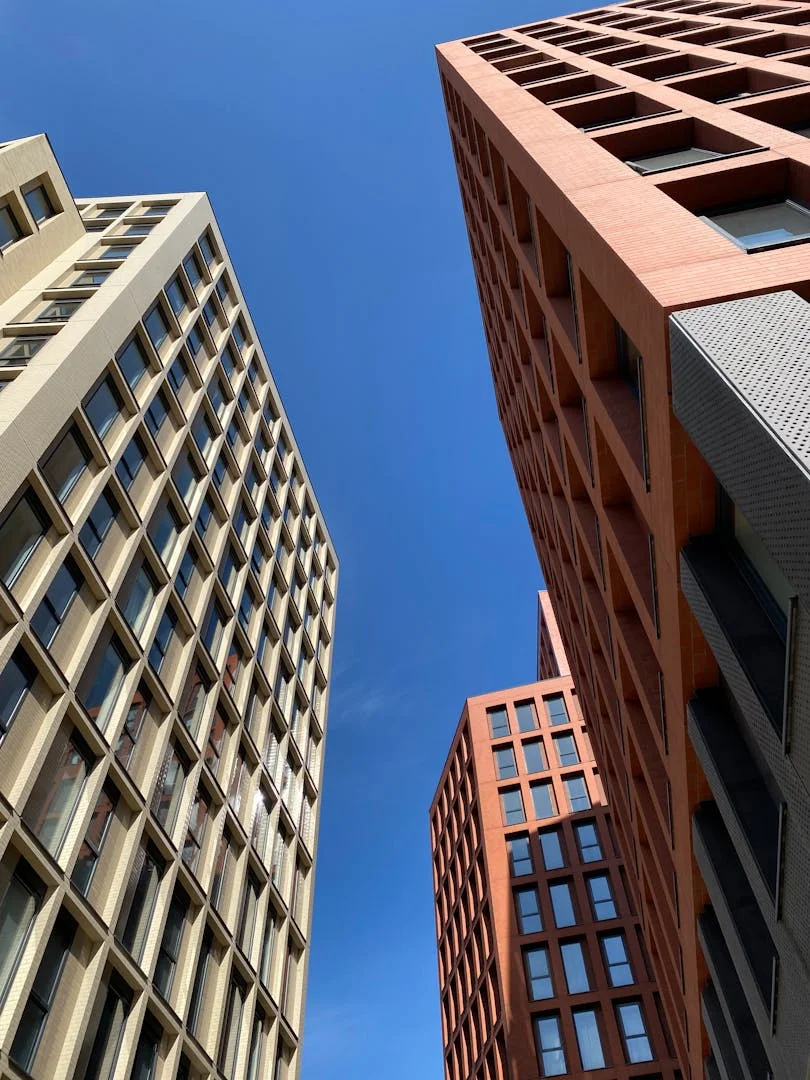
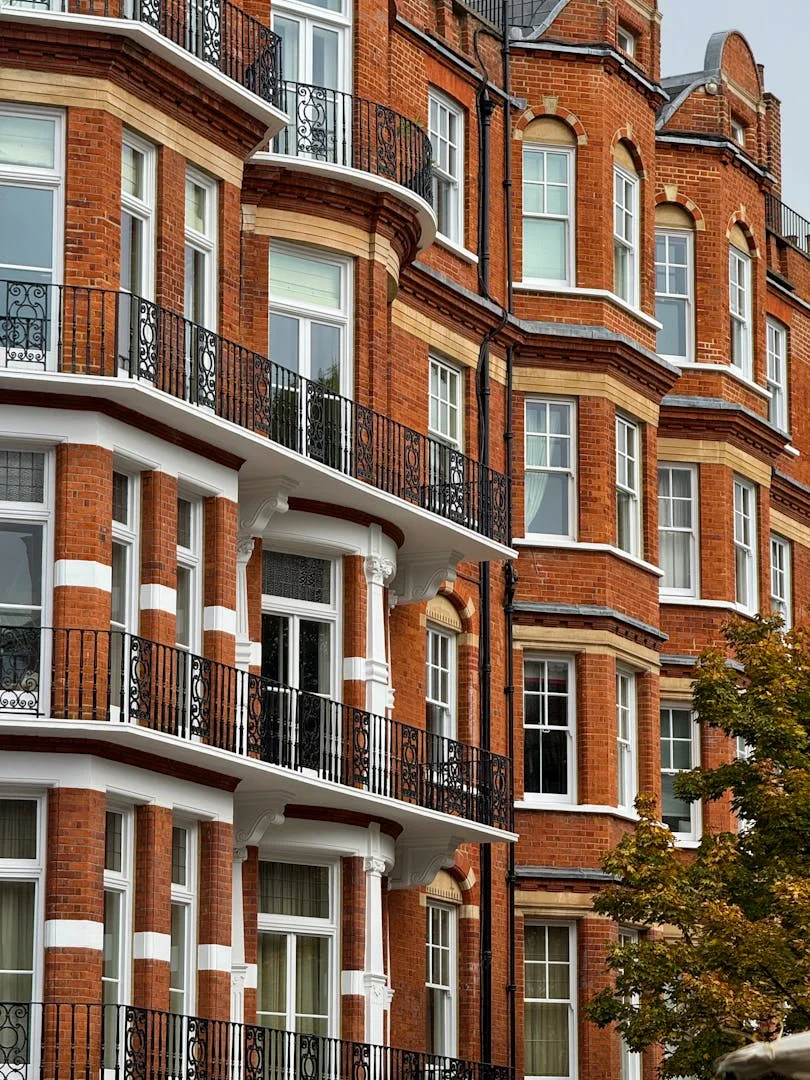
London: Epicentre of the Slide
Central Boroughs Bear the Brunt
 Overall, London has emerged as the region with the most significant property price drops, in particular with the City of London experiencing the steepest decline at 20.7%. As a result, average home values there have plunged to £905,448 – down by a staggering £186,985 from the previous year.
Hot on its heels, Westminster has seen values slump by 20.1%, thereby dragging the average house price down to £1.1 million. In fact, that’s a reduction of over £227,000.
Other notable London declines include:
- Firstly, Kensington and Chelsea saw a significant drop of 15.1%, equivalent to £212,043.
- Similarly, Hammersmith and Fulham experienced a decline of 13.2%, which amounts to £110,998.
- Meanwhile, Islington recorded an 8.2% decrease, or £58,741 less on average.
- Additionally, Camden saw prices fall by 4.5%.
- Furthermore, Newham’s house prices dropped by 6.3%.
- Likewise, Greenwich experienced a 2.8% reduction.
- Finally, Wandsworth saw a modest decline of 2.4%.
While central London continues to command some of the country’s highest property values, the recent downturn suggests a recalibration in the market – perhaps influenced by shifting work habits, affordability ceilings, or reduced demand for high-end homes.
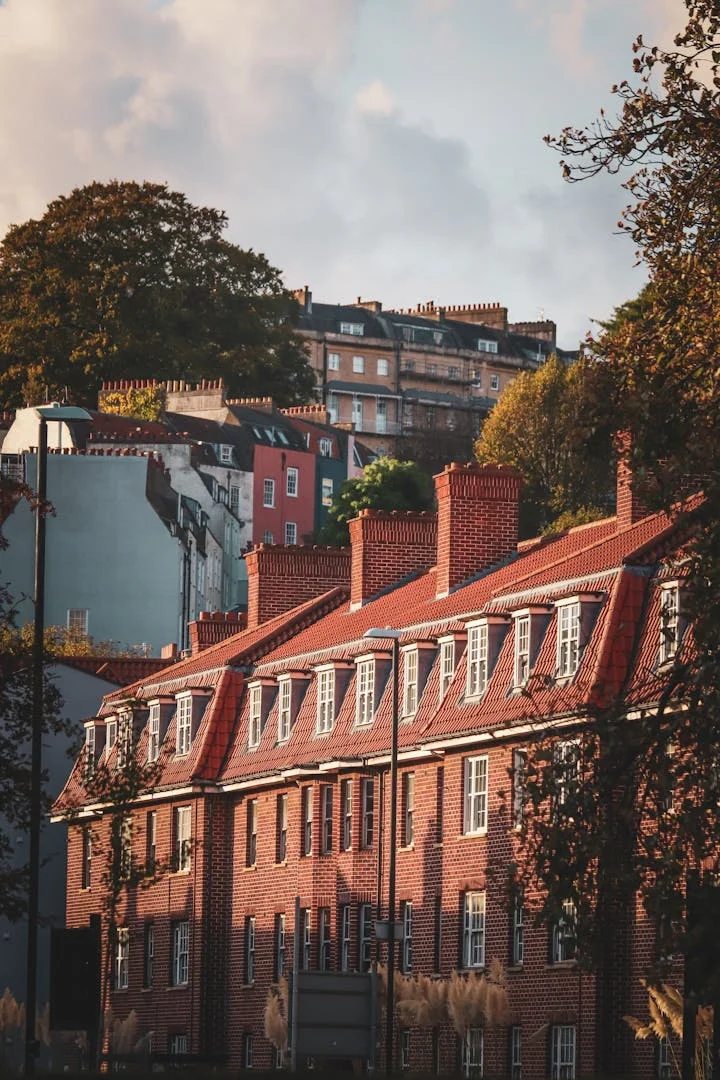
Other Declining Areas Across the UK
Beyond London, several other parts of the country have also seen average property prices fall. Notable examples include:
- Cotswold (Gloucestershire): Down 7%
- City of Aberdeen: Down 3.9%
- Ceredigion (Wales): Down 5.3%
- Argyll and Bute (Scotland): Down 3.8%
- York: Down 1.6%
- Eastbourne (East Sussex): Down 1.5%
- Harlow (Essex): Down 2.5%
- Bath and North East Somerset: Down 1.8%
Though these drops are more modest than those seen in London, they point to a broader trend of softening prices in certain pockets, particularly in regions previously popular for second homes or commuting.
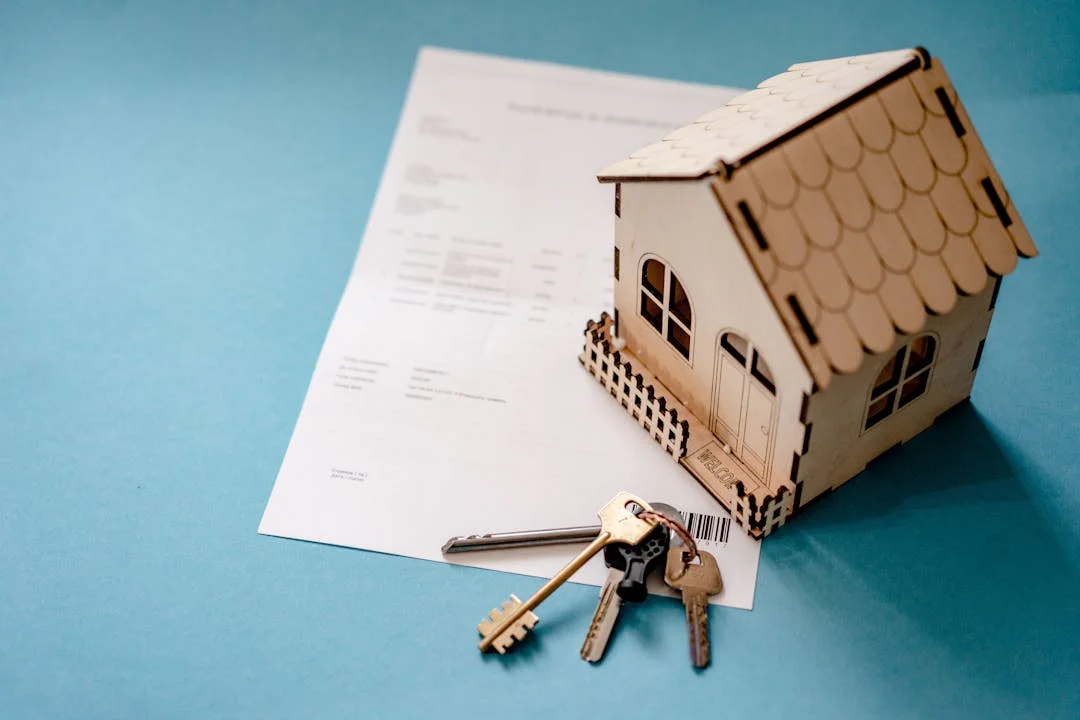
First-Time Buyers Facing Higher Costs
Despite localised price dips, aspiring homeowners are still grappling with rising costs. Across England, first-time buyers paid an average of £249,763 in the year to March 2025. Compared to the previous year, this marks a 7.7% increase, thereby adding nearly £18,000 to the average purchase.
Elsewhere in the UK:
- Wales: First-time buyer costs rose 4.6% to £179,665
- Scotland: Up 4.1% to £152,276
These figures highlight the persistent affordability challenge, particularly for those entering the market for the first time.
Where Prices Are Surging: London Property Prices
 While London stumbles, other parts of the UK have seen a significant uptick in property values.
The standout performer is the Shetland Islands, where, notably, average prices rose by 18.2%, which is equivalent to an extra £35,358. The average home there now costs £194,305 – still below the national average, but growing fast.
In Blackburn with Darwen, prices surged by 16.9%, marking a £23,395 increase and bringing the average house price to £138,142. Consequently, such areas are becoming increasingly attractive for buyers priced out of bigger cities or those seeking better value and quality of life.
Full List of Areas with Declining Property Values
To illustrate, here are the 30 council areas where average house prices have decreased over the past 12 months:
- City of London: -20.7%
- Westminster: -20.1%
- Kensington and Chelsea: -15.1%
- Hammersmith and Fulham: -13.2%
- Islington: -8.2%
- Cotswold: -7%
- Newham: -6.3%
- Ceredigion: -5.3%
- Camden: -4.5%Areas Seeing Biggest Home Price Drops
- City of Aberdeen: -3.9%
- Argyll and Bute: -3.8%
- Inner London (aggregate): -2.9%
- Greenwich: -2.8%
- Harlow: -2.5%
- Merthyr Tydfil: -2.5%
- Wandsworth: -2.4%
- Torfaen: -2.4%
- Bath and North East Somerset: -1.8%
- York: -1.6%
- Eastbourne: -1.5%
- North Norfolk: -1.2%
- Tandridge: -0.9%
- Redditch: -0.8%
- North Ayrshire: -0.6%
- Blaby: -0.5%
- Castle Point: -0.5%
- South Ayrshire: -0.4%
- West Suffolk: -0.3%
- Torridge: -0.2%
- Angus: -0.1%
What This Means for Buyers and Sellers: London Property Prices
For homeowners in the affected regions, these falling values may dampen expectations, especially if considering a sale. On the flip side, buyers – particularly those looking in premium postcodes – could benefit from more negotiable prices and less frenzied competition.
As ever, the UK property market remains highly localised. While some boroughs and districts experience cooling prices, others are heating up – offering a varied landscape that demands careful navigation.
Overall, in uncertain economic times, understanding regional trends has never been more important for making informed property decisions. Whether buying, selling, or investing, knowing where the market is headed locally could make all the difference.